
A good batch pricing spreadsheet does two jobs. It turns your costs, fees and shipping into a minimum price for every item, and it holds a market value column that shows what similar items actually sold for. The first job is arithmetic you can set up in an hour. The second is where most sheets fail, because people fill that column with asking prices. Below you get the columns, the formula, a worked example, a CSV layout and a routine for keeping the sheet honest. We built PricexPoint to fill the market value column from sold listings, so you don't have to research each row by hand.
TL;DR
- Use one row per item and separate your fixed costs (item, postage, per-order fees) from percentage costs (marketplace and payment fees).
- Solve for price with one formula: price = fixed costs ÷ (1 − percentage costs − target margin).
- Keep three price columns: your floor (break-even), the market value from sold data, and the list price you choose.
- Save the sheet as a plain CSV with headers in the first row so it imports into other tools without errors.
- Asking prices tell you what sellers hope for. Sold prices tell you what buyers paid, so the market column should come from sales.
Table of Contents
- What a batch pricing spreadsheet is for
- The columns every pricing sheet needs
- The formula: from cost to price
- Count every cost, or the margin is fiction
- The market value column: where sheets go wrong
- Turning two numbers into a decision
- A CSV pricing template that imports cleanly
- Keep the sheet alive
- Free templates: what to check first
- Price a whole batch with PricexPoint
- FAQ
- Sources
What a batch pricing spreadsheet is for
A batch pricing spreadsheet prices many items at once instead of one at a time. Typical users are resellers sorting a thrift haul, collectors valuing a shelf or a box, small businesses tracking what their stock is worth, and buyers checking a list of second-hand purchases against fair prices.
The sheet answers three questions for every row:
- What is my floor? The lowest price at which I don't lose money after every cost.
- What is the market paying? The range recent buyers actually paid for the same item in the same condition.
- What will I list it at? A decision that sits between the two, based on how fast you want it to sell.
Most templates you find online cover only the first question. They calculate a price from cost and margin, and they never test that number against the market. A price that gives you a 30% margin is no use if buyers pay 20% less than it.
The columns every pricing sheet needs
Start small. Free reseller inventory templates run to 18 columns, including SKU, brand, condition, bin location, lot, dates, fees, shipping and profit, as shown by ResaleChamp's published template. You don't need all of that on day one. For pricing, this core set does the work:
| Column | What goes in it | Why it matters |
|---|---|---|
| Item name | Brand, model, size or edition | Without a precise name, you can't look up comparable sales |
| SKU or ID | A short code you assign | Lets you match rows to photos and bins |
| Condition | A fixed list: New, Like New, Used-Good, Used-Fair, For Parts | Condition moves price more than almost anything else |
| Quantity | Units in the row | Keeps bulk lots from hiding in one line |
| Item cost | What you paid, per unit | The base of every calculation |
| Shipping and supplies | Postage you pay, plus packaging | A fixed cost per order |
| Fee % | Marketplace plus payment processing as a share of price | A percentage cost |
| Floor price | Calculated break-even | Your minimum |
| Market value | Median of recent sold prices | The reality check |
| List price | Your decision | What you post |
| Status and where listed | Unlisted, listed, sold | Prevents double sales |
| Sold price and date | Filled in at sale | Lets you measure how good your estimates were |
Use a dropdown for condition. If one row says "Used-Good" and another says "good used," filters and lookups break. That same template recommends a fixed condition list for exactly this reason.
If you buy pallets or lots, divide the total load cost by the number of sellable units to get the cost per item, as that template suggests. Put that per-item cost in the cost column so every row stays comparable.
The formula: from cost to price
The cleanest way to price a batch is to split your costs into two kinds.
- Fixed costs (F): what you pay in dollars regardless of the sale price. Item cost, postage, packaging, any flat per-order fee.
- Percentage costs (r): fees that scale with the price, written as a decimal. A 13% total fee is 0.13.
For a target margin m (profit as a share of the selling price), the price is:
Price = F ÷ (1 − r − m)
The break-even price, with no profit, is F ÷ (1 − r). This approach is laid out in Sellmath's marketplace pricing guide, which also advises confirming fee figures in your own seller account before acting.
The common mistake is multiplying cost by a markup and stopping there. That ignores the fact that fees take a slice of the sale price itself, so the more you charge, the more you pay in fees. The formula above accounts for that.
Margin versus markup
These two words are used interchangeably and shouldn't be. Margin is profit divided by the selling price. Markup is profit divided by cost. A $10 profit on a $40 sale is a 25% margin, but on a $30 cost it is a 33% markup. Pick one, label the column, and use it everywhere. The formula above uses margin.
A worked example
The fee rate below is a placeholder for illustration. Replace it with your marketplace's current fee schedule. Our marketplace fee comparison walks through how eBay, Poshmark and Mercari differ.
Assume a 13% total percentage fee (r = 0.13) and these three items:
| Item | Cost | Postage and supplies | F | Target margin | Floor (break-even) | Target price |
|---|---|---|---|---|---|---|
| Vintage jacket | $6.00 | $5.00 | $11.00 | 25% | $12.64 | $17.74 |
| Camera lens | $12.00 | $4.00 | $16.00 | 30% | $18.39 | $28.07 |
| Paperback set | $3.00 | $4.00 | $7.00 | 20% | $8.05 | $10.45 |
Check the jacket: $17.74 × (1 − 0.13 − 0.25) = $17.74 × 0.62 = $11.00, which equals F. In a spreadsheet, the target price is one formula you copy down the column: =F2/(1-$H$1-G2), where H1 holds the fee rate and G2 holds the row's margin.
Notice what the table does not tell you: whether a vintage jacket actually sells for $17.74. That is the next column.

Count every cost, or the margin is fiction
The formula is only as good as F and r. Sellers who track true profit include more than the purchase price: inbound shipping, preparation, seller-paid shipping, marketplace and payment fees, a reserve for returns, and their own labor, according to FlipTrade Hub's resale profit guide. That guide also advises treating shipping the buyer pays separately from the shipping you actually pay, since the two rarely match.
If you offer free shipping, the postage moves into F and the buyer's price rises to cover it. Our guide to shipping-included pricing shows how to set and compare those prices.
Fees and postage are also where books go wrong at tax time. If you sell enough that your numbers feed into real accounting, this walkthrough on bookkeeping for ecommerce margins covers how to account for transaction fees and shipping so your true margin matches your spreadsheet.
The market value column: where sheets go wrong
Your floor price protects you. It does not tell you what to charge. For that you need a market value column, and what you put in it decides whether the sheet is useful.
Asking prices are not market prices
An asking price is what a seller hopes to get. A listing can sit unsold for months at a number nobody will pay. If you average a page of active listings, you average optimism. A sold price is a completed transaction: a real buyer paid that amount. Our guide on sold price versus asking price explains why only one of them should anchor your price.
For each item, collect the sold prices of the same model in the same condition, from recent sales. Then record the median rather than the average, because one outlier (a rare sealed copy, or a mislabeled lot) can drag an average far off.

Doing it by hand
For ten items, searching sold listings and typing numbers into a cell is manageable. For two hundred, it eats your week. Each row needs a correct identification, a filter for condition, a check that the sales are comparable and a median. That is also where errors creep in: a different model number, a bundle that includes accessories, a lot sold as five units.
Doing it in bulk with PricexPoint
This is the step we built our app for. You can photograph an item or type its name, and PricexPoint researches sold, asking and new prices across multiple marketplaces, filters out unreliable listings, and links each figure to its sales sources so you can see what it rests on. If the app misidentifies an item, you can correct the identification and get the price for the right one. For batches, it supports bulk pricing through CSV or multi-item photos, and it saves your scan history with export options, so the results can go straight into the market value column of your sheet.
The point is that the market column then holds numbers you can trace to actual sales, instead of numbers you typed from memory.
For category-specific examples, see how sold-price checks work for PC parts, power tools and thrift store finds.
Turning two numbers into a decision
With a floor and a market value in every row, add one more column: the gap. It is simply market value minus floor. Sort by it.
- Gap is comfortably positive: the item has room. List near the median, or slightly above if it is in better condition than most sales.
- Gap is near zero: the item barely clears your costs at market price. Decide whether it is worth the shelf space and your time.
- Gap is negative: at market prices you lose money. Either your cost was too high, the postage is eating the margin, or a cheaper channel with lower fees would work. Don't price above market just to protect your margin; it simply won't sell.
This is also how you set bundle prices. If several items sell together, check whether buyers actually take the other item before you cut the price of one. Our piece on bundle pricing strategy covers checking attach rates first.
Platform choice changes the fee column too. The same item can have a different floor on Etsy, Depop or Facebook Marketplace. See the Etsy pricing playbook, the Depop pricing strategy and the guide to Facebook Marketplace pricing for each.
A CSV pricing template that imports cleanly
Sooner or later you will move your sheet into another tool: an inventory system, a listing tool or a pricing app. The format that travels is CSV, and a few rules prevent most import failures. Inventory software documentation spells them out. Fishbowl's pricing import guide requires:
- Column names in the first row.
- One product per line.
- Comma-separated fields, with text values wrapped in double quotes.
- Prices as plain numbers with no thousands separators: 1234.56 works, 1,234.56 does not.
Their import uses just two fields, a product identifier (number, SKU or UPC) and a price. Other tools differ, so check what yours expects. But the lesson holds everywhere: keep a clean, minimal export tab.
A safe layout for a batch pricing CSV:
sku,item_name,condition,quantity,cost,list_price
JK-001,"Levi's trucker jacket, M",Used-Good,1,6.00,17.99
LN-014,"Canon EF 50mm f/1.8 II",Used-Good,1,12.00,29.99
Tips that save time:
- Keep your working sheet (with formulas, notes and colors) separate from the export tab, which holds values only.
- Avoid currency symbols in number cells. Format the display, not the content.
- Put commas inside names in quotes, or remove them.
- Use the same condition labels everywhere.
Keep the sheet alive
A pricing sheet is a snapshot. Prices drift, fees change and stock moves. A few habits keep it accurate.
Add every item when it arrives. As the ResaleChamp guidance puts it, unrecorded stock is stock you forget you own. A row on day one beats a reconstruction later.
Update the listing location whenever it changes. If you cross-list, record where each item is live and end the other listings the moment one sells. That prevents double sales.
Record the sold price and date. After a few months, compare your target prices with what items actually sold for. If your estimates run high across a category, that category's market column needs a closer look.
Refresh market values on a schedule. Items with volatile prices, like electronics, trading cards or collectibles, deserve a recheck every few weeks. Stable categories can wait longer. Businesses tracking item value over time can use saved scan history to see how a price moved between checks.
Recheck fees. Marketplaces update their fee schedules, and your percentage cost in the formula should follow. Confirm the figure in your seller account rather than relying on last year's number.
Free templates: what to check first
A free template is a fine starting skeleton. Before you adopt one, check four things:
- Does it separate fixed from percentage costs? A single "fees" column that mixes both will give wrong prices.
- Does it have a market value column based on sales? If it only asks you to enter your own guess, it will not test your price.
- Does it use a fixed condition list? Free-text condition fields make filtering unreliable.
- Is it editable and exportable? Make sure formulas aren't locked and that you can export clean CSV.
Build or adapt the sheet once, and every later batch is a copy-and-fill job.
What we think about batch pricing
Most batch pricing problems are not spreadsheet problems. The formulas are easy. What costs sellers money is a market value column filled with guesses, with asking prices, or with the one listing that happened to show up first.
That is why we built PricexPoint around evidence. Our price estimates are linked to actual sold listings from several marketplaces, we name every data source, and we don't give a figure without supporting evidence. You can open the sales behind a number, correct the item identification if it is wrong, and see the price update for the right item.
For a batch, that means you can feed in a CSV or a multi-item photo, get sold, asking and new prices back, and export the results into the sheet you already use. Your spreadsheet keeps doing what it does best, which is the arithmetic on your costs. The market side comes from sales you can trace.
PricexPoint
Price a whole batch with PricexPoint
If your market value column is the slow part, PricexPoint handles it: snap a photo or type an item name, or run a batch through CSV or multi-item photos, and get sold, asking and new prices with links to the sales sources. There is a free tier to start. Paid monthly plans are Basic at $4.99 per month, Pro at $9.99 per month and Power at $24.99 per month. If you prefer one-off token packs, 100 tokens cost $5.99, 300 tokens cost $12.99 and 1000 tokens cost $34.99.
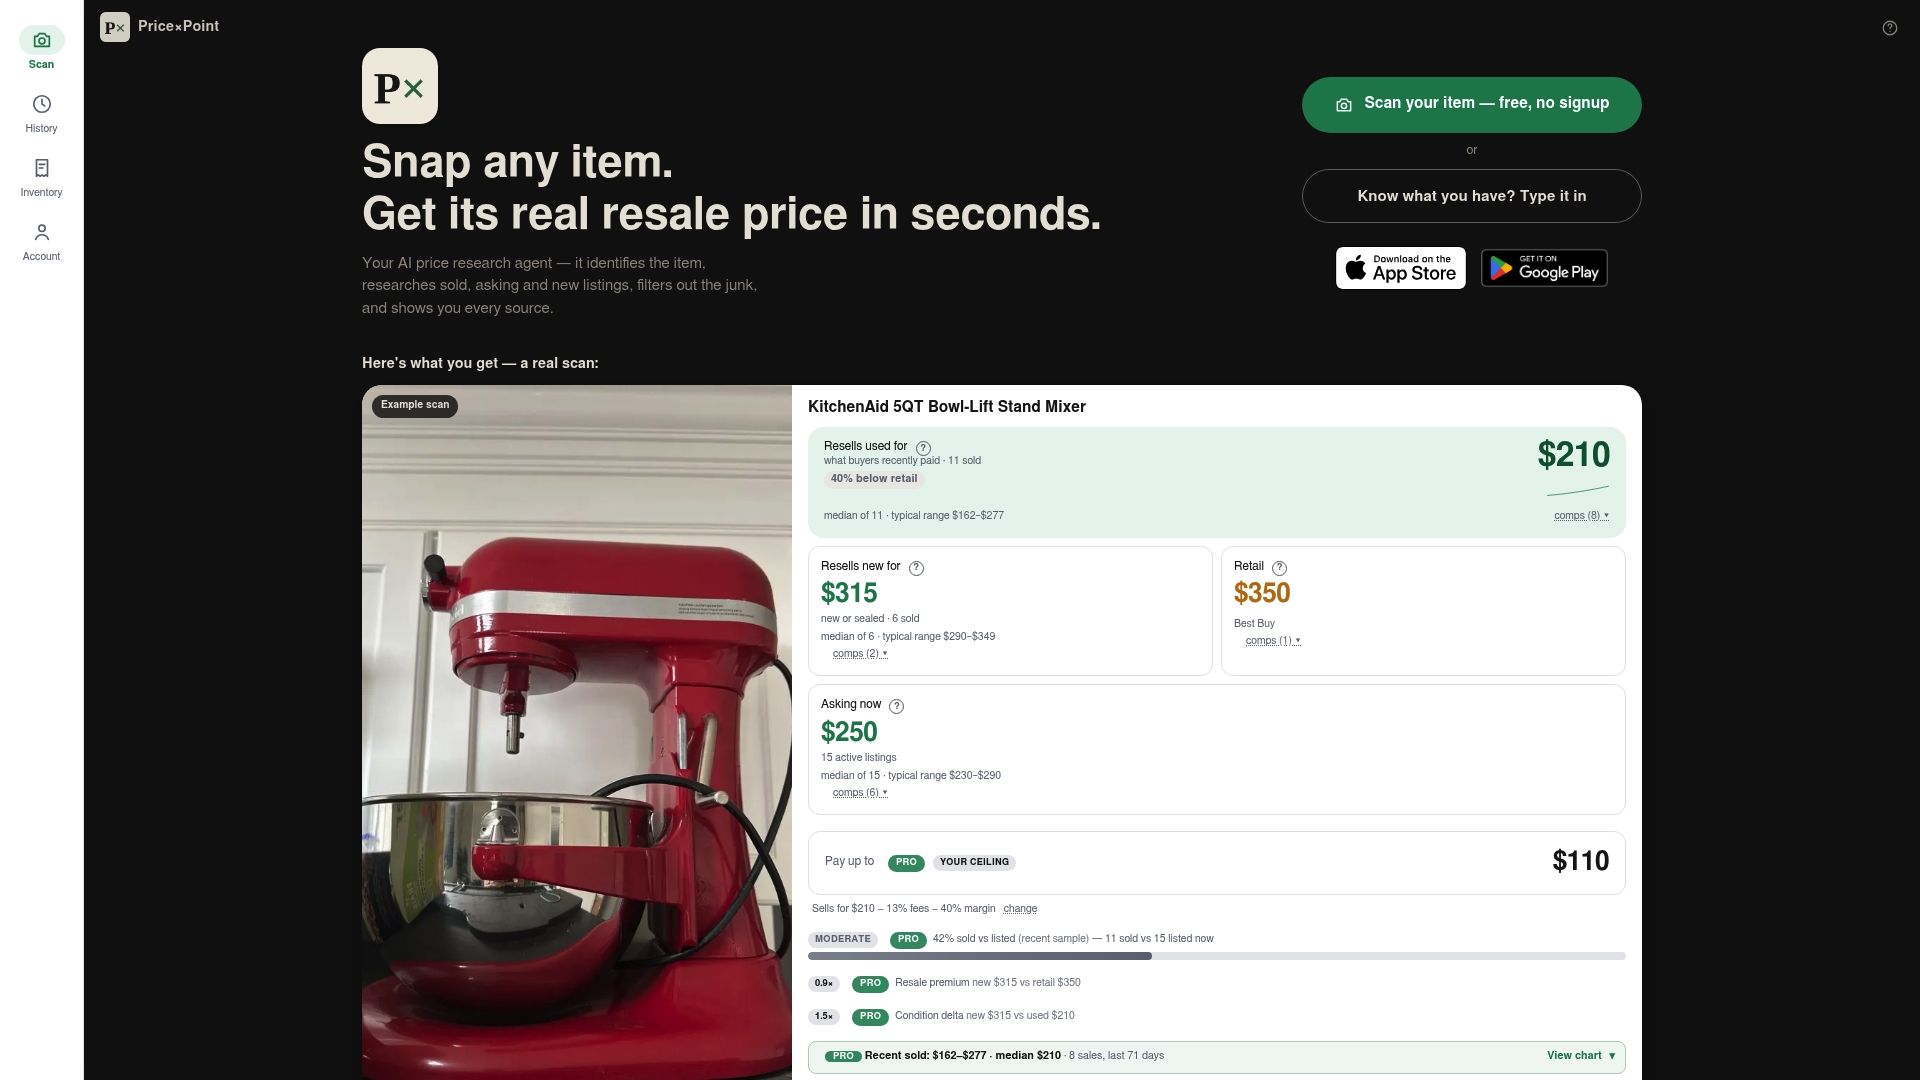
See the plans and token packs to pick the one that fits your volume, or look up what an item sells for on our sold price pages.
FAQ
What is a batch pricing spreadsheet?
It is a sheet where each row is an item and the columns calculate a price for all of them at once. A good one covers your costs, fees and target margin, and also holds a market value taken from recent sold prices.
What should a pricing spreadsheet template include?
At minimum: item name, condition, quantity, cost, postage, a fee percentage, a floor price, market value, list price and a sold price column for later review. Keep fixed and percentage costs in separate columns so the price formula works.
How do I calculate a resale price from my cost and fees?
Add your fixed costs (item, postage, packaging) into one figure, express percentage fees as a decimal, and divide the fixed costs by one minus the fees minus your target margin. For $11 of fixed costs, 13% fees and a 25% margin, that gives $17.74.
Can I use a CSV file instead of a spreadsheet?
Yes, and it is the best format for moving data between tools. Put column names in the first row, one item per line, quote text that contains commas, and write prices as plain numbers without thousands separators. PricexPoint supports bulk pricing through CSV, so a clean file speeds up a large batch.
How do I know if my price is fair?
Compare it with what the same item in the same condition recently sold for, not with what others are asking. If your price sits well above the median sold price, expect it to wait. If it sits below your floor, you are losing money on the sale.
Sources
- Free Reseller Inventory Spreadsheet Template (ResaleChamp)
- The pricing formula for marketplace sellers (Sellmath)
- Resale Profit Calculator: Break-Even, Fees & ROI (FlipTrade Hub)
- Importing/Exporting Product Pricing (Fishbowl)