
There is no single average time to sell for used items. The number depends on the category, the condition, the platform and above all the price relative to what similar items actually sold for. The useful version is your own figure: the median number of days from listing to sale for the kind of item you sell, set beside the sold prices of comparable items. This guide shows how to measure it, what moves it, and how to use sold data to set a price that sells on the timeline you want.
If you searched this phrase and landed on house-sale statistics, those are a different market. This article is for resellers, collectors, sellers clearing out a home, and buyers who want to read a listing's age as a clue to fair value.
TL;DR
- Time to sell is the number of days between the day a listing goes live and the day it sells. Report the median, not the mean, so one stale item doesn't distort the picture.
- Price is the biggest lever you control. In one academic study of an online marketplace, a higher price relative to predicted market value was consistently linked to longer selling times.
- Platform choice is a speed-versus-price trade-off: fast platforms clear low-priced items quickly, slower ones can pay more per item.
- Sold listings, not asking prices, tell you where an item will clear. Pricing from them is how you shorten the wait without leaving money on the table.
- Track days to sell per category in a simple sheet or an exported scan history, then reprice anything that sits past your own benchmark.
Table of Contents
- What "average time to sell" means for used items
- Why the median beats the average
- How long does it take to sell on eBay?
- What actually changes how fast an item sells
- Benchmarks: what is a reasonable wait?
- Use sold data, not asking prices, to estimate your wait
- For buyers and collectors: reading time to sell
- Putting it into practice with PriceXPoint
- Our perspective
- FAQ
- Sources
What "average time to sell" means for used items
For secondhand goods, time to sell (also called days to sell) is a duration: the calendar days from the date an item is listed to the date it is sold. It is easy to confuse with sell-through rate, which is a percentage: items sold divided by items listed in a given window, such as 90 days. Sell-through tells you how much of your stock moves. Days to sell tells you how fast it moves. You want both, but they answer different questions. If you want the percentage side done properly, our guide on verifying sold data before calculating sell-through rate covers it.
A second, accounting-style version exists for businesses: days to sell inventory, calculated across a whole period from average inventory cost and cost of goods sold. It suits a shop reporting monthly. Most individual sellers are better served by the per-item version, because it can be checked against real listings and acted on item by item.
Why the median beats the average

Suppose you sold four items in a month, after 11, 30, 44 and 104 days. The mean is 47.25 days. The median, the middle of the sorted list, is 37 days. Neither number is wrong, but the mean is pulled upward by the one item that lingered, and if you priced your next batch around it you would be reacting to an outlier.
The effect grows with a long tail. Secondhand listings have one: a few items sell in hours, many sell in weeks, and a handful sit for a year. A single year-old sale can move the mean by weeks while the median shifts by one position in the sorted list. So the method is:
- Record the listing date and the sold date for every sale.
- Subtract to get days for each item.
- Sort the list from shortest to longest and take the middle value.
- Fix the window (for example, the last 90 days) so figures stay comparable from month to month.
- If you relisted an item, time it from the relist date, and note how many sales were relists. Otherwise a relisted item looks faster than it really was.
Two more habits keep the number honest. First, measure by category. A median across vintage T-shirts and furniture blends two different markets and describes neither. Second, count only sold items. Items still sitting unsold aren't in the figure at all, which is why the median of sold items always flatters you slightly. Your unsold stock is part of the story, and that is what sell-through rate captures.
How long does it take to sell on eBay?
There is no official eBay figure for all items, because the spread is enormous. Sellers who have published their own results report everything from a few hours to well over a year for the same marketplace, which is exactly the long tail described above. Treat any single "average on eBay" as a story about that seller's inventory, not a rule.
What you can say with confidence is that demand on the platform is broad and growing. eBay's 2026 Recommerce Report found that 47% of consumers surveyed buy secondhand goods at least monthly, up from 35% in 2025, and that Collectibles & Memorabilia (31%), Electronics & Computers (27%) and Books, Movies & Music (24%) are the most popular seller categories. More buyers means more chances for a correctly priced listing to sell, but it also means more competing listings in those same categories.
So the practical answer to the eBay question is a method, not a number: pull the sold listings for your exact item, see how many sold in the last 90 days, and compare that to how many are active. Few sales against many active listings means a long wait. Many sales against few listings means a quick one.

What actually changes how fast an item sells
Price relative to market value
This is the factor you control completely. A study from the Hungarian research network MTA, Estimating Liquidity in Online Marketplaces via Machine Learning and Survival Analysis, analyzed used cars on an online marketplace. It found median selling times typically fell between 12 and 13 days when the asking price was at or below the predicted market value, and that a higher price-to-value ratio was consistently associated with longer selling times, with the effect amplified by extreme overpricing. Cars are not sweaters, but the logic carries: buyers compare, and a listing priced well above comparable sales waits.
The flip side matters just as much. Pricing far below value can sell quickly, but you've paid for that speed. Our guide on how to price used items to sell fast without underpricing walks through finding the point where an item is competitive but not given away.
Category and demand
Fast movers are typically low-priced, widely wanted, easy-to-judge items. Slow movers are expensive, niche, bulky or hard to evaluate from photos. Furniture, collectibles with a narrow buyer pool and high-value pieces usually wait longer than everyday clothing or small electronics. Seasonality adds another layer: coats, bikes and holiday items have windows. If you are listing outside the window, expect a longer wait or plan to hold the item.
Condition and presentation
Buyers pay quickly for items they trust. Clear photos, an honest condition description, correct identification (model, size, edition) and complete details reduce hesitation. A mislabeled item attracts the wrong buyers and misses the right ones. Getting the identification right is also what makes any sold-price comparison valid, since a near-match with a different model number can be worth far more or far less.
Platform and fees
Where you list changes both the pace and the price. Research from the UK's Charity Retail Association, published in its June 2026 Marketplace Manual, found that one fashion-focused platform sold items in an average of 9 days at an average sale price of £27, while a luxury platform took 34 days but averaged £146 per sale. The figures come from UK charity retail, so treat them as an illustration of the pattern rather than a universal benchmark. The pattern is the point: speed and price pull against each other, and neither choice is wrong. If you need to clear space or stock is seasonal, speed may be worth a lower price. If an item is high-value, patience can pay.
If you are deciding between general marketplaces, our comparison of eBay, Mercari and Poshmark and the breakdown of marketplace fees show how fees change what you keep. For electronics specifically, see where to sell used electronics and what they go for.
Benchmarks: what is a reasonable wait?
Because sources differ and every inventory is different, set benchmarks from your own history. A workable approach is to sort your sold items into price bands and categories and note the median for each. Then use simple rules:
| What you see | What it usually means | What to do |
|---|---|---|
| Sells in a day or two | Price may be below market value | Check sold comps; raise the price on the next similar item |
| Sells near your category median | Priced in line with the market | Keep the approach |
| Sits well beyond your category median | Overpriced, misidentified, or weak photos | Re-check sold comps, fix the title and photos, then reduce |
| Never sells after repeated drops | Thin demand or wrong platform | Try a different venue, bundle it, or hold for the season |
The rule of thumb to keep: very fast sales are a clue that you may have underpriced, and very slow sales are a clue that you have overpriced or listed in the wrong place. Neither is a verdict until you compare against what similar items actually sold for.
Use sold data, not asking prices, to estimate your wait
An asking price is a wish. A sold price is a fact. Active listings include optimistic prices that never clear, and anchoring on them is the most common way sellers end up with items that sit. For a deeper look at the difference, see sold price vs. asking price: which one is real.
Here is a repeatable way to estimate both the price and the likely wait for any item:
- Identify it exactly. Brand, model, size, edition, color, condition. One wrong detail changes the comparison.
- Collect recent sold listings for that exact item, ideally the last 60 to 90 days. Note the price and, where visible, how long listings were up.
- Count active competitors. The ratio of items sold to items listed gives you a rough feel for demand.
- Group by condition. New, used and for-parts items should never be averaged together.
- Choose your position. Price at the middle of recent sold prices for a typical wait. Price toward the lower end of the sold range for a faster sale. Price toward the top only if your item is clearly better than the comps and you can wait.
- Set a review date. If it hasn't sold by your category median, re-check the comps and adjust.
A worked example: you have a used camera lens. Recent sold listings for your exact model and condition range from $180 to $240, with most near $210. Dozens sold in the past 90 days and only a handful are active. That points to healthy demand, so pricing near $210 should sell in a reasonable time, while $180 might sell within days and $240 may wait. You choose based on how quickly you need the cash. The point is that you now choose deliberately instead of guessing.
If you also run an online store alongside your marketplace listings, mobile optimization for online stores can shape how easily shoppers browsing on phones convert, which feeds into how quickly your own site's listings sell.
For buyers and collectors: reading time to sell
Selling time is also useful when you are on the other side. An item that has been listed for months at a price far above recent sales is probably overpriced, and the seller may accept less. An item that sells within hours at a given price tells you that price was attractive. If you are valuing a collection or a single piece, look at how many comparable items sold, at what price, and how quickly. A wide range of sold prices tells you that condition and completeness matter, so verify those before you pay. Estate sales are a special case where nothing has a tag; see pricing an estate sale for how to approach it.
Putting it into practice with PriceXPoint
Doing the sold-data research by hand across several marketplaces is slow, and slow research is the reason many sellers fall back on asking prices. PriceXPoint is an AI price research app: snap a photo of an item or type its name, and it returns sold, asking and new listings from multiple marketplaces, filters out unreliable listings, and links each estimate to the sales it came from. You can verify and correct the item identification, which keeps the comparison honest. For a batch, it supports bulk pricing through a CSV or multi-item photos, and it saves your scan history with export options, which gives you a ready-made record of what you priced and when.
Plans are Basic at $4.99 per month, Pro at $9.99 per month and Power at $24.99 per month. If you'd rather not subscribe, token packs are one-off: 100 tokens for $5.99, 300 tokens for $12.99 and 1000 tokens for $34.99. There is also a free tier. See the details on the pricing page.
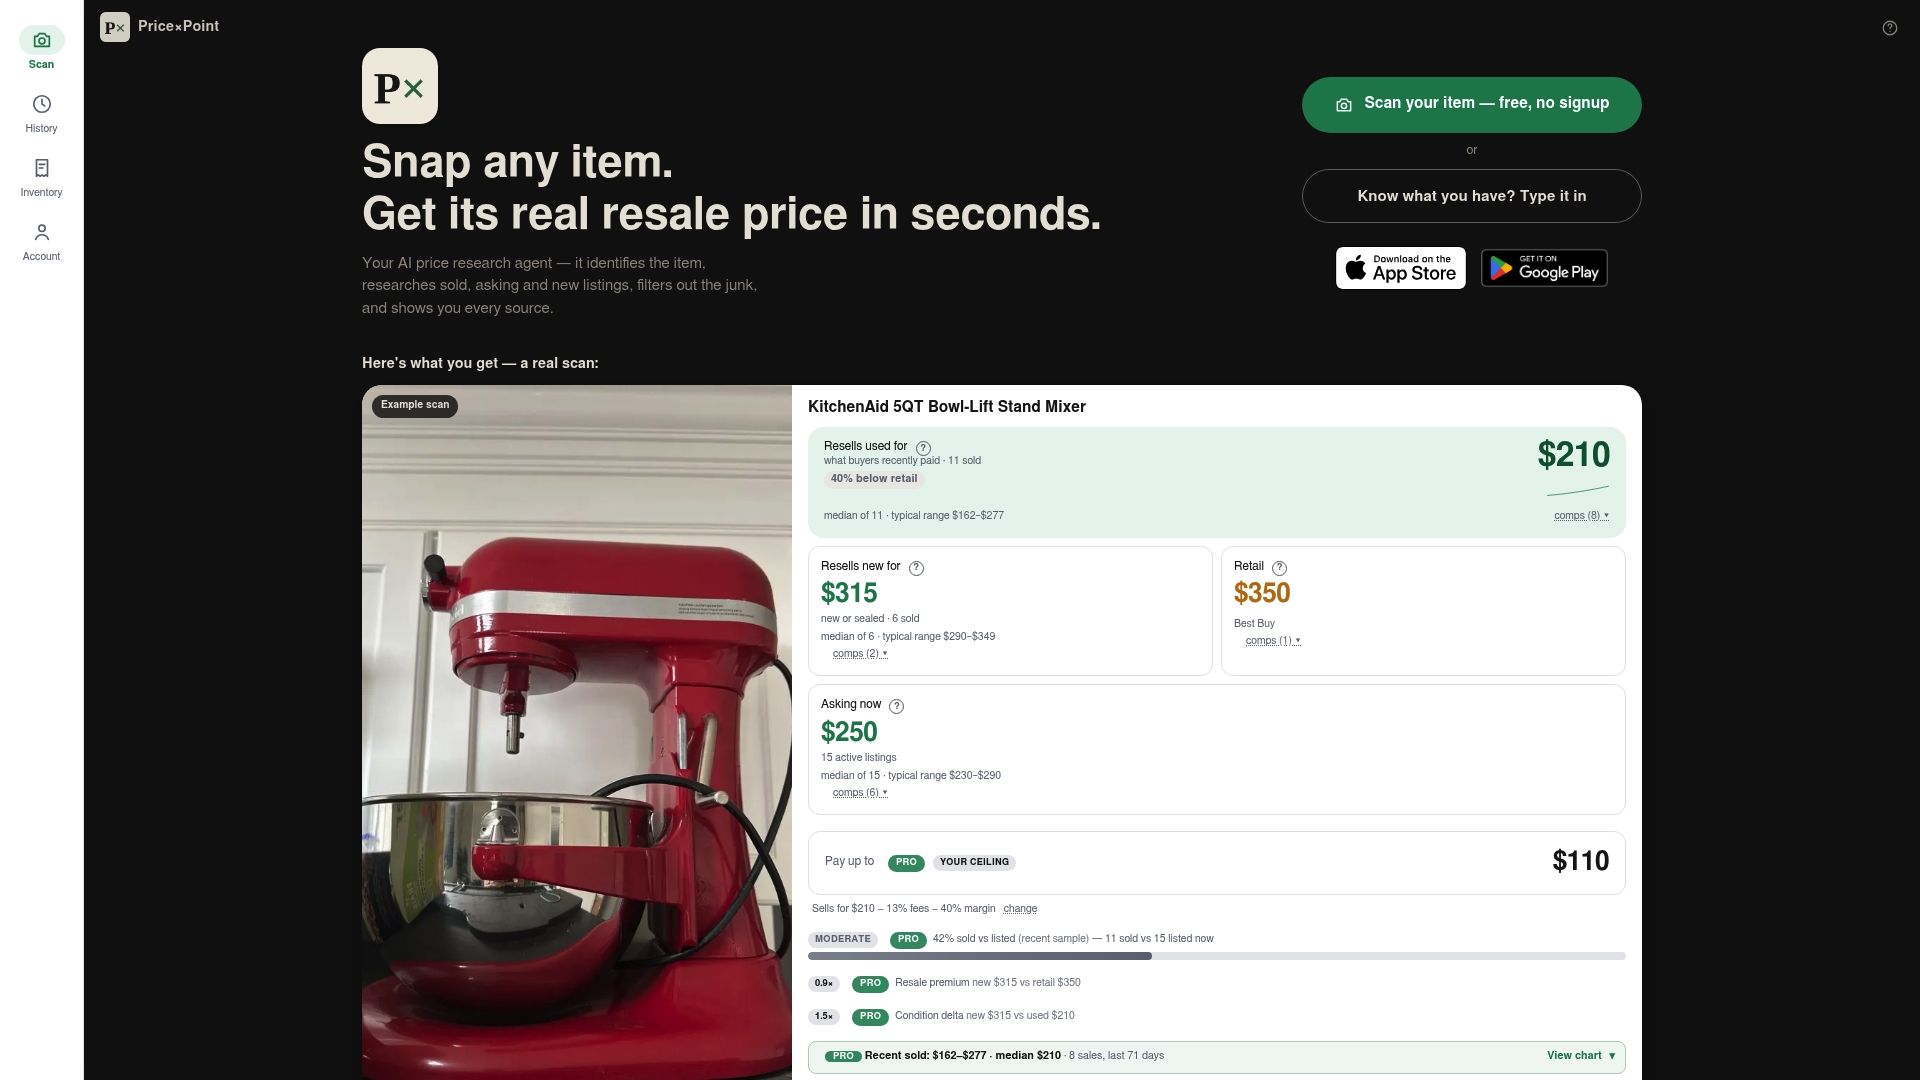
For a look at what a sold-price result looks like, browse what used items sell for, based on real sold prices. If you want to understand how AI estimates compare with other approaches, read can an AI app tell you what something is worth and the guide to apps for finding out what something is worth.
Our perspective
Most advice on time to sell starts from the wrong number. Sellers quote an average, or worse, a platform's headline claim, and then try to match it. The number that matters is the median for your category, measured from sold items, and the lever that moves it most is price.
That is why we built PriceXPoint around evidence. Our estimates are linked to actual sold listings from several marketplaces, every data source is named, and we don't give a figure without supporting evidence. When you can open the sales behind a price, you can see how many comparable items sold, at what level, and decide where to sit in that range: priced to move this week, or priced to wait for the right buyer.
We also think speed and price should be a choice, not an accident. A seller who knows the sold range can price at the low end for a quick clear-out or at the high end for a patient sale, and know which one they chose. Saved scan history and export make it easy to keep that record, so that after a few months you have your own median days to sell by category instead of someone else's guess.
PricexPoint
FAQ
What is a good average time to sell for secondhand items?
It depends on the category, so use your own median as the benchmark. Everyday items priced at market usually move faster than furniture, high-value pieces or niche collectibles. If an item sells well inside your category median, check whether you underpriced it. If it sits far beyond it, compare your price to recent sold listings.
Should I use the mean or the median for days to sell?
Use the median. A single item that sat for a year can inflate the mean and push you to react to an outlier, while the median moves by only one place. Fix a time window, such as 90 days, and note how many sales were relists so the figure stays honest.
How do I make an item sell faster without cutting the price too far?
Start with sold listings for the exact item and condition, then price toward the lower half of that sold range. Make sure the title and photos identify the item correctly. Our guide on pricing to sell fast explains how to find that point without underpricing.
Is sell-through rate the same as time to sell?
No. Sell-through rate is a percentage of listed items that sold in a window, while time to sell is the number of days a sale took. Track both: one shows how much of your stock moves, the other shows how quickly.
Sources
- Estimating Liquidity in Online Marketplaces via Machine Learning and Survival Analysis
- eBay 2026 Recommerce Report
- Charity Retail Association: the charity retailer's guide to selling beyond eBay